Lessons taught by a Coin
"Your idea has to be original only in its adaptation to the problem you are working on"-Edison.
In the last chapter of Security Analysis (1934), Ben Graham mentioned about an experiment done by Frederick Macaulay to prove the invalidity of technical analysis.
Experiment:
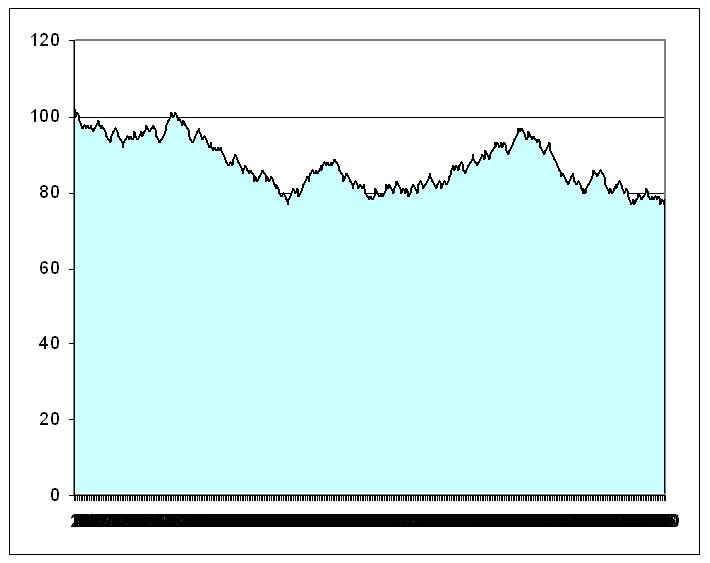
"...Frederick Macaulay plotted the results of tossing the coins several thousand times (heads = one point up; tail = one point down) & had thereby obtained a graph resembling in all respects the typical stock chart--with resistance points, trend lines, double tops, areas of accumulation, etc. Since the chart could not possibily hold any clue as to the future sequence of heads or tails, there was a rather strong inference that stock charts are valueless." (Pg no: 608)
I got fascinated & wanted to try it out myself. The plan was to plot a chart with 100 coin tosses & see how it looks like. But then I looked at the chart & wanted to check if regression to mean holds. In the process I ended up with 400 coin tosses & few important lessons.
Invalidity of Technical Analysis:
Everybody will agree that it would be fallacious to look at the above chart and conclude that there will be a more head or tails in the next 50 tosses.
One argument that, I think, people who believe in technical analysis can use against the logic here is 'Each coin toss is an independent event, whereas daily stock price moments may not be independent events. How do you rationalise it?'
I don't know the answer but it reminds me of wonderful quote by Ben Franklin,
"There's none deceived but that he trusts."
Gambler's Fallacy:
There were many instances where I had sequence of 5 heads or tails in a row. I could clearly hear in the back of my mind, while the coin went up in the air, that this time it should be head or tail based on the past vivid sequence.
All this even after being aware of the fact that each coin toss is an independent event & it has got nothing to do with the past events. This is also one of the reason that I continued till 400 (ie) I did it until I stopped predicting, subconsciously. This reminds me of what Tversky & Kahneman have said,
"Under some conditions, when the conditions are knowable, we should not trust our intuition because we are liable to predictable errors & biases. Also the fact that we can predict in advance, when intuition might falter, gives us some hope of implementing procedures to avoid the errors."
posted by Arpit Ranka at 4:52 PM
![]()
![]()


10 Comments:
Keep in mind that I'm predominantly a value & contrarian investor focused on the fundamentals of individual stocks, while you read my comment.
"had thereby obtained a graph resembling in all respects the typical stock chart" - except for one important note, HIS graph was random, whereas stock charts are NOT. That being said, I favor using numerical technical indicators of overbought or oversold conditions and don't really use charted lines.
I downloaded the GE historical prices from Yahoo!Finance, and developed the split-adjusted "typical" (average of open/high/low/close) daily price. I then calculated the 20-day RSI (common technical analysis indicator, consult investopedia) and the following 10-day change in the price of the stock, for the period 3/24/92 through 11/21/05. You can do this yourself, to verify it.
Here's what I found. The maximum RSI generated was 85, and the minimum was 20. 96.8% of the readings were between 30 and 75, inclusive. For the times that RSI was below 30, over the next ten days the average increase in GE stock price was 2.5% and the stock had a higher typical price, 10 days later, 72% of the time. When the RSI was above 85, the corresponding change was -0.7% and 73% chance of decline in 10 days.
The population average was a 0.6% increase and 55.4% chance of increase for the entire period.
In summation, there ARE technical indicators that work, to some limited degree. I have found them useful to some degree, even though I predominantly work on screening stocks for low valuation and strong fundamentals.
try this link.
May widen the horizon of thinking.
regards,
Ravi Pathak
http://stockcharts.com/education/Overview/techAnalysis1.html
This comment has been removed by a blog administrator.
can i have your email address,
I would like to share with you something interesting.
mine is ravipathak1@gmail.com
regards,
Ravi Pathak
arpitranka@yahoo.com
Regards,
Arpit
I think the proff of pie is in eating.
I wrote a software which did this.
Plotted cumulative result of coin tosses and compares with real life charts.
Sent the coin toss charts and real stock charts to some friends.
Many of them told that the coin toss charts is "un-usual".. many of the things they see and feel in stock charts is missing.
The inter-relation among waves.
The speed of moves.
Speed of fall were all suspicious.
Two things which look "somewhat-similar" does not means the source is the same phenomenon.
Coin toss is random.. doesnot means that a somewhat-similar looking chart also was effect of random stuff.
summary:
the article tries to relate unrelated things?
i think this was not so hard to deduce.!!
cheers
rajeev
Rajeev:
From the post:
"One argument that, I think, people who believe in technical analysis can use against the logic here is 'Each coin toss is an independent event, whereas daily stock price moments may not be independent events. How do you rationalise it?'
I don't know the answer..."
Moreover you concluded by saying
"Coin toss is random.. doesnot means that a somewhat-similar looking chart also was effect of random stuff."
If you believe that stock charts are not random, then you can conclude that the article tries to relate unrelated things and can classify as noise.
But if somebody believes that stock charts are indeed random then the article may be informative.
All in all, the validity of the article is dependent on the pre-conveived notions of the reader on the subject matter.
Rgds,
Arpit
It is really a fascinating paper!! I got some clear ideas after reading ur paper!
However, do u mind to tell me where is this quotation come from >"<?
"...Frederick Macaulay plotted the results of tossing the coins several thousand times (heads = one point up; tail = one point down) & had thereby obtained a graph resembling in all respects the typical stock chart--with resistance points, trend lines, double tops, areas of accumulation, etc. Since the chart could not possibily hold any clue as to the future sequence of heads or tails, there was a rather strong inference that stock charts are valueless." (Pg no: 608)
Thank you!
If I recall correctly, it was a footnote in the 1934 edition.
Let me know if you still have trouble finding this. I will dig deeper for the exact details.
Thanks
I found it! Thanks a lot!! :)
Post a Comment
<< Home